
For buyers, that gap means cash-flow-focused strategies now favor multifamily and industrial, while office remains a bet on repositioning rather than income. Detailed sourcing and submarket breakdowns follow below.
TL;DR:
- Atlanta multifamily cap rates remain in the low-to-mid 5% range, with core submarkets like Buckhead and Midtown trading tighter due to investor demand.
- Industrial properties generally see steady cap rates around 6.94%, driven by consistent demand and limited new supply, while office cap rates vary widely based on lease rollover and tenant credit.
- Cap rates across submarkets can differ by 75 to 150 basis points, with suburban and repositioning areas demanding higher yields to reflect lower liquidity and higher risk.
- Rising interest rates favor income-producing assets like multifamily and industrial, causing their cap rates to hold steady or compress, while office continues to see wider spreads.
- Investors should compare cap rates to mortgage costs carefully, ensuring their leverage remains positive and stress-testing exit assumptions with wider cap rate buffers for safer underwriting.
Table of Contents
- What Are Atlanta Cap Rates by Property Type Right Now?
- How Much Do Cap Rates Vary Across Atlanta Submarkets?
- Why Are Atlanta Cap Rates Moving in 2026?
- How Should You Compare Cap Rate to Your Mortgage Rate?
- Where Does Atlanta Cap-Rate Data Actually Come From?
- Which Providers Should Investors Use for Atlanta Cap-Rate Data?
- What's the Recommended Cap-Rate Target by Investor Strategy?
- What's Driving Atlanta's Cap-Rate Trend Right Now?
- How Do Atlanta Cap Rates Compare to National Averages?
- How Do Job Growth and Population Trends Affect Atlanta Cap Rates?
- What's the Outlook for Atlanta Cap Rates Through the Rest of 2026?
- What Risks Could Push Atlanta Cap Rates Wider?
- Get Atlanta-Specific Guidance for Your Next Deal
- Sources
- FAQ
What Are Atlanta Cap Rates by Property Type Right Now?
The numbers vary sharply depending on which asset class you're underwriting, and lumping them together into one "market cap rate" is how investors talk themselves into a bad deal.
The most current figures reconciling vendor reports come from Matthews' Q1 2026 Atlanta industrial market report, which puts the blended commercial average at 6.94%. But Northmarq's tracking of Atlanta multifamily transactions shows deals closing in the low-to-mid 5% range through late 2025 and into 2026, driven by improving rent growth and tightening vacancy.
A few things jump out. Multifamily's tight range reflects sustained investor appetite. Industrial's consistency, as Matthews' data shows, comes from steady demand and limited new supply hitting the market at once. Office is the outlier: that 150-basis-point-plus spread means two office buildings a mile apart can price completely differently depending on lease rollover and tenant credit.
Treat these as mid-2026 figures, not static benchmarks. Cap rates move quarterly, and the gap between asking-price yields and closed-transaction yields can run 50 to 75 basis points on its own. Always confirm whether a reported range reflects actual closings or listed offers before you build a pro forma around it.
How Much Do Cap Rates Vary Across Atlanta Submarkets?
Location inside Atlanta moves the number as much as property type does. Buckhead and Midtown command the tightest cap rates in the metro because institutional capital chases trophy assets there regardless of yield, often pricing 50 to 100 basis points below the metro average for comparable asset classes.
Transitioning neighborhoods and suburban submarkets tell a different story:
- Buckhead and Midtown: Core, high-barrier locations where buyers accept lower going-in yields for appreciation potential and liquidity.
- Beltline-adjacent and West Midtown: Repositioning premiums, with cap rates that can compress fast once a corridor gentrifies.
- Suburban nodes (Alpharetta, Marietta, Johns Creek): Higher going-in cap rates, often 75 to 150 basis points above core submarkets, reflecting less liquidity but stronger cash flow at acquisition.
- Class A vs. Class B/C: A well-leased Class A asset in a secondary submarket can out-price a tired Class B building in a prime location, since tenant quality and lease term drive investor confidence as much as zip code.
The practical takeaway: don't anchor your underwriting to a single metro-wide average. Match the comp set to the submarket and asset condition, not just the property type.
Why Are Atlanta Cap Rates Moving in 2026?
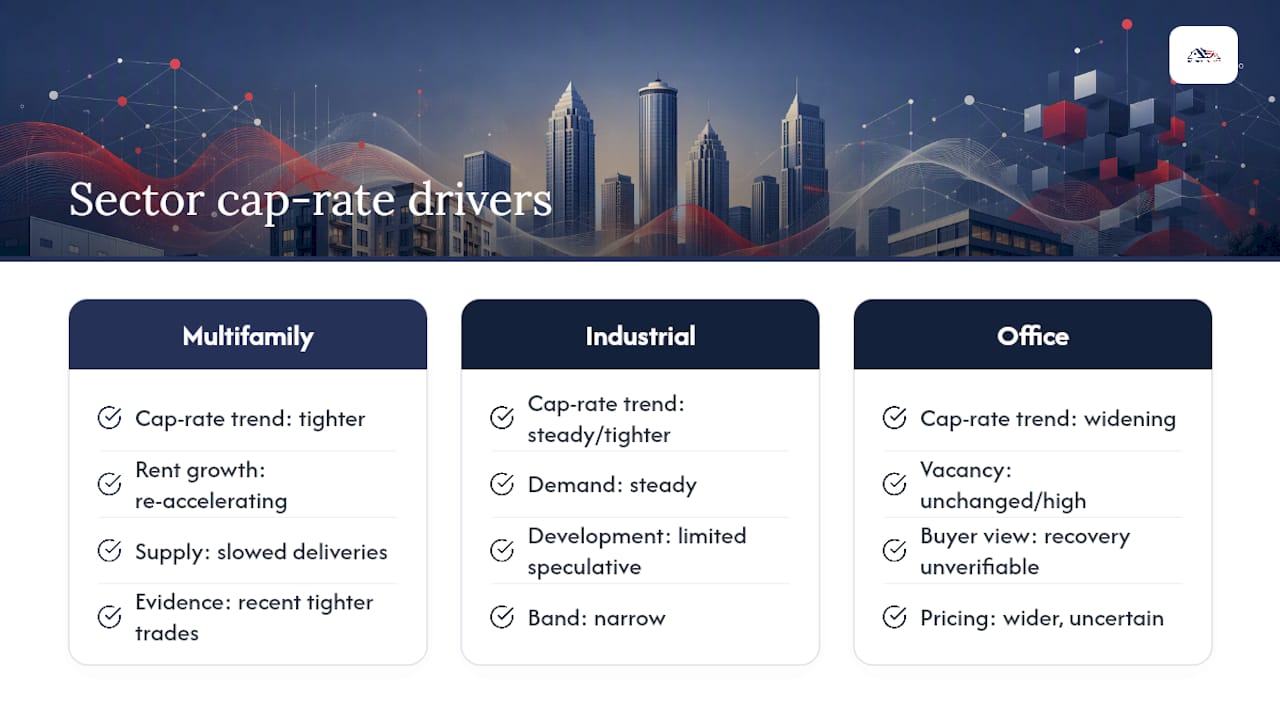
Cap rates in Atlanta have been compressing in multifamily and holding steady to tightening in industrial, while office continues to drift wider. Three forces explain most of that movement.
- Interest rates are reshaping buyer preference. Higher borrowing costs push capital toward assets with dependable current income rather than speculative rent-growth bets, which is a major reason multifamily and industrial have held up better than office.
- Office vacancy keeps that sector's cap rates elevated. Structural vacancy from hybrid work hasn't fully resolved, and buyers price that risk into wider spreads, sometimes north of 9% for older, undifferentiated stock.
- Construction pipeline and rent growth favor multifamily. Deliveries have slowed from the 2022 to 2023 peak, and Northmarq's Atlanta reporting points to improving rents and falling vacancy as the reason multifamily cap rates have settled into the low-to-mid 5% band.
Retail sits in between, benefiting from limited new supply but still working through the fallout of certain national tenant closures. Short-term, expect multifamily to stay tight, industrial to hold, and office to remain the sector where patient, contrarian capital finds the widest entry points.
How Should You Compare Cap Rate to Your Mortgage Rate?
The single most useful gut-check in underwriting is comparing your cap rate to your expected mortgage rate. If the cap rate exceeds your borrowing cost, you're in positive leverage territory, meaning debt amplifies your return. If it's below, every dollar of leverage works against you.
That comparison matters more in 2026 than it did five years ago, because financing costs have risen faster than cap rates have adjusted in some sectors. A primer on commercial mortgage rate trends is worth reading before you run numbers, since even a 50-basis-point shift in your financing assumption can flip a deal from cash-flow positive to a drag.
Here's a short underwriting checklist worth running on every Atlanta deal:
- Verify NOI quality. Strip out one-time concessions, below-market renewal options, and non-recurring expense reductions.
- Compare going-in cap rate to your all-in financing cost, not just the headline mortgage rate.
- Separate value-add math from stabilized math. A lower going-in cap rate can still work on a value-add deal if your business plan genuinely lifts NOI; that same rate on a stabilized asset just means you overpaid.
- Stress-test reserves. Confirm capex reserves and vacancy assumptions match the asset's actual age and deferred maintenance.
- Pull recent closed comps, not asking prices, for your exit cap assumption.
Pro Tip: Run your exit cap rate 50 to 100 basis points wider than your entry cap rate. It's the cheapest insurance you can build into a Atlanta underwriting model, and it exposes deals that only work if the market keeps getting better.
Where Does Atlanta Cap-Rate Data Actually Come From?
Every vendor report tells a slightly different story, mostly because they're measuring different things. Some track asking yields on active listings; others track only closed transactions. Knowing the difference keeps you from comparing apples to spreadsheets.
- CoStar Group aggregates listing and transaction data across sectors, making it a go-to for tracking cap-rate movement over time, though its scale means figures sometimes lag the freshest closed deals.
- CBRE and Colliers publish local market reports and capital-markets research that pair cap-rate benchmarks with actual large-trade comparables, useful for sanity-checking vendor averages against real closings.
- Public calculators and aggregator tools can show noticeably different bands than transaction-based reports; always check whether a source is using asking or closed data before trusting the number.
When the numbers disagree, prioritize recent closed transactions and large trades in your specific submarket over blended metro averages. For anything above a few million dollars, a paid report or a local advisory relationship is worth the cost.
Which Providers Should Investors Use for Atlanta Cap-Rate Data?
Different providers serve different jobs. Matching the right one to your specific question saves time and money.
- Real Capital Analytics, Inc. focuses on transaction trends and capital-flow analytics, making it a strong pick for research on institutional buying patterns and capital-market activity.
- CBRE offers capital markets advisory alongside local market reports, suited to investors who want both data and deal execution support.
- Colliers brings valuation advisory and local research teams, useful when you need an investor-facing read on a specific submarket.
- CoStar Group runs the deepest transaction database for cap-rate tracking across sectors, best for investors who want to pull comps themselves.
- Northmarq - Dallas specializes in arranging debt and equity for commercial deals, the right call when financing structure is your bottleneck.
- Sherman & Hemstreet Real Estate Co. offers regional brokerage and property or portfolio management with a longstanding Southeast presence, fitting investors who want a single relationship for both transactions and ongoing management.
For transaction comps, start with CoStar or Real Capital Analytics. For capital markets advice or financing structure, CBRE, Colliers, or Northmarq are the more natural calls.
What's the Recommended Cap-Rate Target by Investor Strategy?
Core buyers chasing Buckhead or Midtown multifamily should expect to underwrite in the 5.0% to 5.75% range and lean on appreciation, not yield, for total return.
Immediate next steps on any prospective deal:
- Pull closed-transaction comps for your exact submarket, not metro-wide averages.
- Stress-test your financing assumption against current commercial mortgage rates before finalizing your offer.
- Loop in a local property manager or broker advisor early, especially for assets requiring lease-up or repositioning.
Red flags: NOI inflated by one-time concessions, cap rates quoted from asking prices rather than closings, and office assets priced as if vacancy will resolve on a timeline nobody can actually promise.
What's Driving Atlanta's Cap-Rate Trend Right Now?
Atlanta's cap-rate story in 2026 is really two stories running in parallel. Multifamily and industrial are compressing or holding steady because capital is chasing dependable income in a higher-rate environment. Office is doing the opposite, drifting wider as buyers price in the real cost of unresolved vacancy.
Rent growth has re-accelerated in multifamily after a soft stretch in 2023 and 2024, and that improvement is showing up directly in the tighter cap rates Northmarq is tracking on recent trades. Landlords watching Atlanta rent trends closely will recognize the connection: stronger rents mean stronger NOI, and stronger NOI is exactly what lets a buyer accept a tighter yield.
Construction deliveries have slowed from their 2022 to 2023 peak across most sectors, which is easing the oversupply pressure that had pushed some suburban multifamily cap rates wider two years ago. Industrial remains the most disciplined sector, with limited new speculative development and steady demand keeping its cap rate band narrow.
Office is the exception to almost every trend line above. Vacancy hasn't meaningfully improved in older stock, and buyers aren't willing to underwrite a recovery timeline they can't verify. Expect that bifurcation, tight residential and industrial pricing against wide, uncertain office pricing, to persist through the rest of 2026 unless borrowing costs drop meaningfully or office demand shifts.
How Do Atlanta Cap Rates Compare to National Averages?
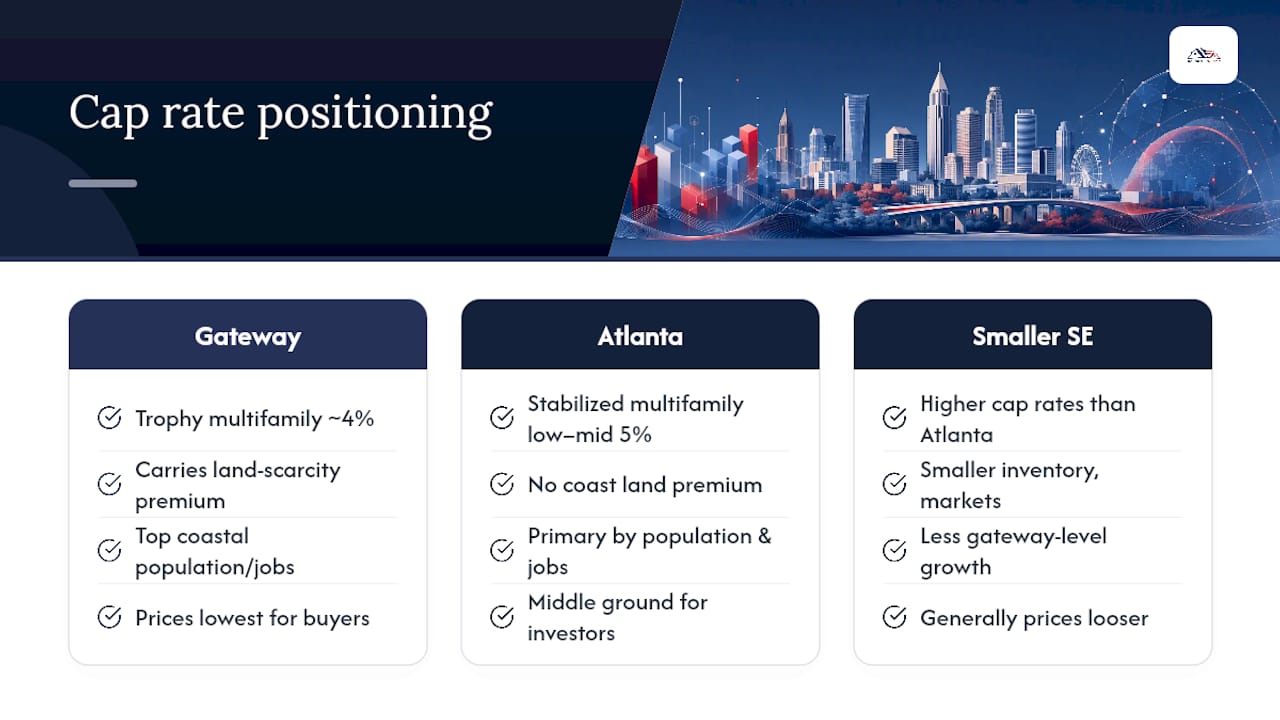
Atlanta generally prices inside the national range for major property types, but it tends to sit slightly favorable to buyers compared with coastal gateway markets like New York, San Francisco, or Boston. Gateway markets often see multifamily cap rates compress into the 4% range for trophy assets, while Atlanta's stabilized multifamily trading in the low-to-mid 5% band gives investors a meaningfully higher yield for comparable asset quality.
That gap exists because Atlanta, despite strong fundamentals, doesn't carry the same land-scarcity premium as the coasts. It's a secondary market by capital-flow standards but a primary market by population and job growth, which is exactly the combination value investors look for.
Within the Southeast, Atlanta trades roughly in line with peer metros like Charlotte and Nashville, sometimes offering a slight yield premium over Nashville given Atlanta's larger overall inventory and more diversified employment base. Compared to smaller Southeast markets like Columbia or Chattanooga, Atlanta typically prices tighter, reflecting its status as the region's dominant logistics and corporate hub.
The practical read for investors: Atlanta offers a rare middle ground. You're not paying gateway-market prices, but you're buying into gateway-level population and job growth. That combination is a big part of why national capital keeps flowing into the metro even as cap rates here sit above what you'd find in New York or Los Angeles.
How Do Job Growth and Population Trends Affect Atlanta Cap Rates?
Atlanta's population and employment growth are the underlying reasons cap rates haven't drifted as wide as they have in slower-growth metros. Every net new resident and every new corporate relocation adds to the demand side of the equation, and that demand shows up in NOI growth before it ever shows up in a cap-rate report.
The metro's diversified job base, spanning logistics, film and entertainment, fintech, and corporate headquarters activity, gives it more resilience than markets dependent on a single industry. When one sector slows, another tends to pick up the slack, which keeps vacancy from spiking across the board the way it can in single-industry towns.
Population growth matters just as much for multifamily specifically. Steady household formation supports the rent growth that's been driving multifamily cap-rate compression, and it's a big reason suburban submarkets like Alpharetta and Johns Creek keep attracting capital despite pricing above core-submarket yields.
The risk worth watching: if job growth cools faster than expected, cap rates could widen quickly in the submarkets most dependent on a single employer or industry cluster. That's less a citywide risk than a submarket-specific one, which circles back to why comp-level due diligence matters more than trusting a metro-wide average.
What's the Outlook for Atlanta Cap Rates Through the Rest of 2026?
Office is the wild card. Absent a clear catalyst, expect office cap rates to stay wide, and expect continued bifurcation between well-leased trophy office and everything else.
Hotel remains the most volatile category, sensitive to both travel demand swings and higher operating costs, and it's the sector most likely to surprise in either direction.
The broader forecast: Atlanta's fundamentals, job growth, population gains, and a diversified economy, support continued investor interest even if cap rates don't move dramatically in either direction. Most experienced buyers in this market are underwriting for stability rather than betting on sharp near-term compression.
What Risks Could Push Atlanta Cap Rates Wider?
The biggest risk isn't a single event, it's a stack of smaller pressures that can compound if you're not underwriting for them. Property tax reassessments are the most common surprise; Atlanta's rising valuations mean a property purchased at one tax basis can see a significant increase after a sale triggers reassessment, directly compressing NOI and pushing your effective cap rate lower than projected. Reviewing how property taxes work in Atlanta before closing is worth the hour it takes.
Regulatory risk is real but uneven. Landlord-tenant rules and eviction timelines vary by jurisdiction within the metro, and any given submarket's local ordinances can affect how quickly you can execute a value-add repositioning plan.
Interest-rate volatility remains the largest macro risk. If mortgage rates rise further, the leverage math that currently supports positive leverage in multifamily and industrial could flip negative, pushing buyers to demand wider cap rates across the board to compensate.
Finally, watch construction pipeline risk sector by sector. A wave of new deliveries in any one submarket, particularly suburban multifamily, can push cap rates wider locally even while the metro-wide average holds steady.
A Local Perspective on Atlanta's Cap-Rate Data
The residential investors I talk with make the same move commercial buyers do: they lean on local property managers and broker advisors instead of guessing at NOI from a spreadsheet. Reliable rent collection and honest expense reporting are what actually separate a good cap rate from a fantasy one.
— Matt
Get Atlanta-Specific Guidance for Your Next Deal
Vendor reports and national averages are a starting point, not a underwriting tool. Atlanta investors can benefit from working with a local team that manages rent rolls behind the numbers, providing real NOI data instead of a metro-wide estimate.

Operational services that impact cap-rate assumptions include tenant screening and placement, rent collection, financial reporting, maintenance coordination, and lease renewals across Atlanta and surrounding suburbs, including Marietta, Alpharetta, and Johns Creek. If you're evaluating a multifamily or residential investment property and want a realistic read on achievable NOI before you finalize your offer, request a property management proposal and get numbers grounded in what similar properties in your target submarket are actually collecting, not what a listing sheet claims.
FAQ
What Are Current Cap Rates for Multifamily Properties in Atlanta?
Stabilized multifamily in Atlanta is trading in the low-to-mid 5% range as of mid-2026, with core submarkets like Buckhead and Midtown pricing tighter and suburban assets running 75 to 150 basis points higher.
Is a 7.5% Cap Rate Good in Atlanta?
It depends on the property type: 7.5% is on the wide end for multifamily or industrial, suggesting either higher risk or an undervalued deal, but it's on the tight end for office, where the current range runs 7.5% to 9%-plus.
Is $90,000 a Good Salary in Atlanta?
For a single earner, income above the median household level supports a reasonable standard of living given the metro's cost of living relative to coastal cities, though housing costs vary significantly by neighborhood and should be checked against specific rental or ownership targets.
How Do I Calculate a Cap Rate?
Divide a property's net operating income by its current market value or purchase price; the result is the cap rate, and comparing that figure to your expected mortgage rate tells you whether leverage will help or hurt your return.